How well does FQ read the real value of chances?
We examined 651 matches played across 20 leagues in October 2026. FQ tracks teams' goal tallies, the match winner and an independent xG model strongly and consistently.
What is FQ?
FQ (Finishing Quality) is Goalscope's measure of the quality of the chances a team creates during a match, expressed in goals. A team with an FQ of 1.8 has produced attacking play worth "about 1.8 goals on average". FQ is calculated from live match statistics; it does not need shot coordinates or tracking data. That means it speaks the same language even in leagues where xG is not available.
FQ is not a prediction tool: it does not tell you the result in advance, it summarises the quality of what has happened on the pitch so far. The question of this report follows from that: how closely does the story FQ tells match the way the game actually ended?
Data and sample
The study covers 20 leagues: Premier League, La Liga, Serie A, Bundesliga, Ligue 1, Turkey's Süper Lig, Eredivisie, Liga Portugal, Championship, Belgian Pro League, Brazil's Série A, Argentina's Liga Profesional, MLS, Saudi Pro League, Scottish Premiership, Russian Premier League, Greek Super League, Austrian Bundesliga, J1 League and Poland's Ekstraklasa.
Of the 766 league matches completed in regular time between 1 and 31 October 2026, 651 were analysed. To be included, a match needed complete live measurement data for its full duration, a calculated full-time FQ and goal events that matched the final score exactly. Cup, play-off and friendly matches were excluded. Scores are regular-time results.
Findings
1. More FQ, more goals — steadily and step by step
At team level, the link between FQ and goals scored was strong and significant on all three correlation measures:
| Measure | Value | 95% CI |
|---|---|---|
| Pearson r (linear) | 0.571 | 0.530 – 0.608 |
| Spearman ρ (rank) | 0.536 | 0.492 – 0.577 |
| Kendall τ (rank concordance) | 0.415 | 0.380 – 0.449 |
Goals are by nature rare and highly random; in a single match the same chances can bring zero goals or three. Despite that volatility, a correlation of around 0.57 shows that FQ captures attacking quality strongly.
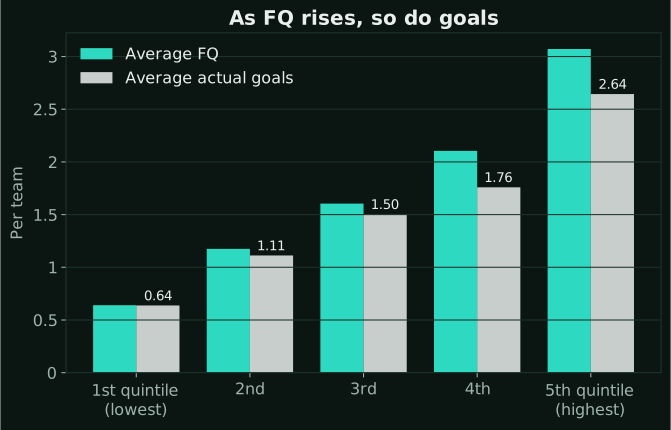
FQ's mean absolute error in estimating a team's goals is 0.86 goals. Answering the same question using only "how many goals do teams score on average in this league?" gives an error of 1.03 goals; FQ cuts the error by 17% compared with that simple approach.
2. Regression models say the same thing
In a Poisson regression — the standard approach for count data such as goals — FQ was a strong and significant predictor: a 1-unit increase in FQ raises the expected number of goals by about 58%. The spread of the data is consistent with the Poisson assumption (dispersion ratio 0.74), and a negative binomial model fitted as a check returned exactly the same coefficient.
Because tempo and scoring levels can differ between leagues, we also fitted a mixed-effects model with league as a random effect. The league component turned out to be very small (league variance 0.007 against residual variance 1.10) and the FQ slope was unchanged (0.82). In short, FQ works on the same scale across very different football cultures.
3. It points to the winner most of the time
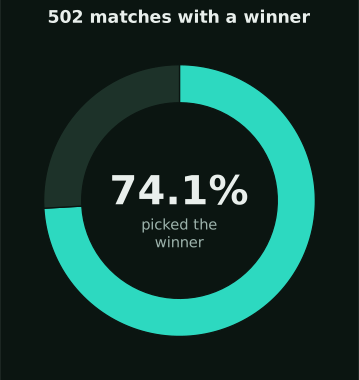
In the 502 matches that had a winner, the team with the higher FQ won 74.1% of the time (95% CI 69.9% – 77.9%). The FQ difference separates home wins with a ROC-AUC of 0.82, and its Brier score of 0.172 is 29% better than a model that knows only the average win rate (0.244).
Including draws, the team with the FQ edge avoided defeat in 80.2% of matches. The correlation between the FQ difference and the goal difference is 0.59.
4. Consistent in both halves
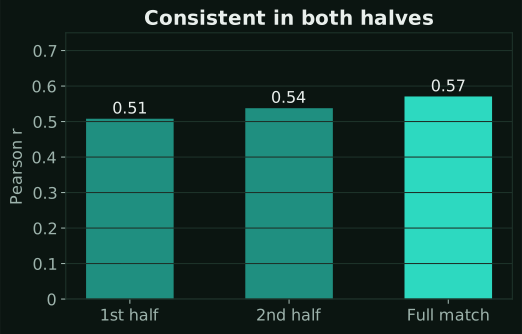
When FQ is calculated separately for the first and second halves, the relationship holds in both (r = 0.51 and 0.54). FQ is meaningful not only as a full-time total but also as the match unfolds.
5. League by league
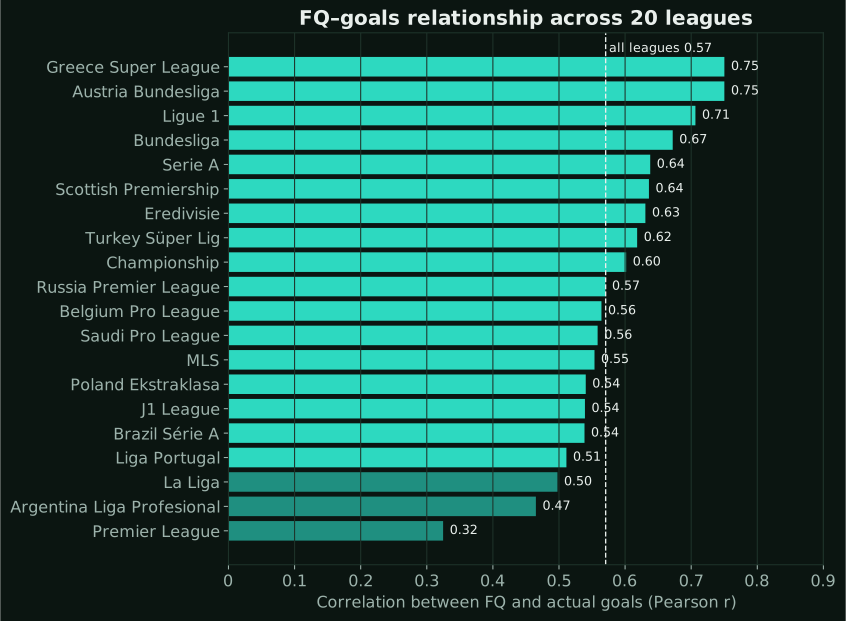
The correlation reached 0.75 in the Greek Super League and the Austrian Bundesliga, 0.71 in Ligue 1 and 0.67 in the Bundesliga. Turkey's Süper Lig, at 0.62, is above the overall average. With 17 to 69 matches per league, individual league values can fluctuate from month to month, so the combined 20-league results should be taken as the reference.
6. Comparison with an independent xG model
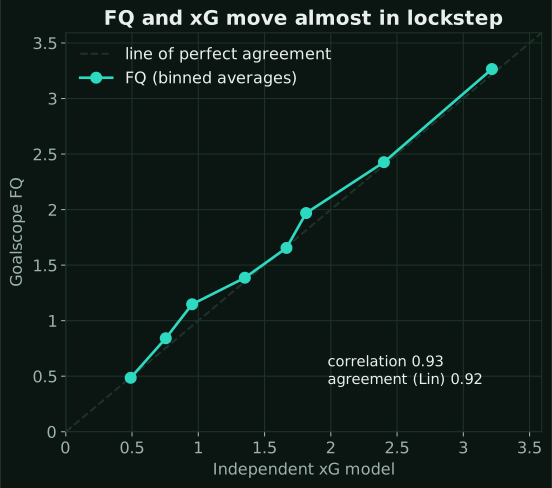
xG (expected goals) is a widely used industry measure calculated from details such as the location and type of each shot. We compared FQ with an independent, publicly available xG model in the six leagues it covers (Premier League, La Liga, Serie A, Bundesliga, Ligue 1 and the Russian Premier League).
| Agreement measure | Value |
|---|---|
| Pearson correlation (FQ – xG) | 0.927 [0.906 – 0.944] |
| Lin's concordance (CCC) | 0.921 [0.898 – 0.939] |
| Bland–Altman mean difference | +0.07 goals |
| Deming regression slope | 0.91 |
| Same side shown as stronger | 89.7% |
The two measures move almost in lockstep, with a correlation of 0.93. Lin's concordance coefficient, which looks not just at correlation but at whether the values actually coincide, is 0.92 — in the "near-perfect" agreement band. On average FQ sits just 0.07 goals above xG. The xG model, which knows where each shot was taken, shows a somewhat stronger link with actual goals (0.64 vs 0.57); that FQ gets this close using only live statistics, without shot coordinates, is what makes it reliable in leagues where xG is not available.
Method
- Unit
- Team-match (651 matches, 1,302 observations). For match-outcome analyses the unit is the match.
- Correlation
- Pearson r, Spearman ρ and Kendall τ reported together. Confidence intervals use a match-clustered bootstrap (1,500 resamples, 2.5th – 97.5th percentiles), since the two teams in the same match are not independent.
- Error measures
- Mean absolute error (MAE) and root mean square error (RMSE); benchmark: league average.
- Regression
- Log-link Poisson regression (with match-clustered robust standard errors), negative binomial regression, linear calibration regression and a linear mixed-effects model with league as a random effect.
- Outcome discrimination
- Sign agreement (winner accuracy), ROC-AUC, and Brier score via logistic regression.
- xG comparison
- Pearson/Spearman correlation, Lin's concordance correlation coefficient (CCC), Bland–Altman agreement analysis and Deming regression; Williams–Steiger test for the difference between dependent correlations with goals, a Diebold–Mariano-type test for the error difference and McNemar's test for the winner-accuracy difference.
- Matching
- Matches in the comparison data were matched by date (±1 day), normalised team names and a score check; matches whose scores disagreed were not accepted.
Limitations
This report is based on one month of data and the number of matches per league is limited. Because goals are highly random events, no measure can fully explain the outcome of a single match. At very high FQ values, actual goals fall slightly short of FQ (calibration slope 0.82) — a reminder that heavy chance creation does not always convert at the same rate. The results describe association and make no causal claim.
The short version: Numbers from the Pitch, Issue 1 →
Read the SCOPER October 2026 report →